Professor Chuan He came to our hospital today and gave us an inspiring lecture.
Some philosophy
New York is 3 hours ahead of California but it does not mean that California is slow, or that New York is fast.
Both are working based on their own "Time Zone."
Some one is still single. Someone got married and 'waited' 10 years before having a child.
There is another who had a baby within a year of marriage.
Someone graduated at the age of 22, yet waited 5 years before securing a good job; and there is another who graduated at 27 and secured employment immediately!
Someone became CEO at 25 and died at 50 while another became a CEO at 50 and lived to 90 years.
Everyone works based on their 'Time Zone'.
People can have things worked out only according to their pace.
Work in your “time zone”.
Your Colleagues, friends, younger ones might "seem" to go ahead of you.
May be some might "seem" behind you.
Everyone is in this world running their own race on their own lane in their own time.
God has a different plan for everybody.
Time is the difference.
Obama retires at 55, Trump resumes at 70.
Don't envy them or mock them, it's their 'Time Zone.'
You are in yours!
Hold on, be strong, and stay true to yourself.
All things shall work together for your good.
You’re not late … You are not early ... you’re very much On time!
Stay blessed.
You Are In Your Time Zone....
Motif analysis of eCLIP data with Homer
Copied from EpiGenie some technological definition:
RIP-chip & RIP-seq: RIP can be coupled to microarray (RIP-chip) or sequencing (RIP-seq) to identify RNAs that are bound by an RBP of interest. Both rely on the specificity of RBP-RNA interaction for immunoprecipitation.
HITS-CLIP (or CLIP-seq): Stands for high-throughput sequencing of RNA isolated by crosslinking immunoprecipitation, which utilizes in vivo UV crosslinking technologies and next-gen sequencing.
PAR-CLIP: Photoactivatable-ribonucleoside-enhanced crosslinking and immunoprecipitation attempts to solve some of the problems of HITS-CLIP, namely, efficiency of crosslinking and resolution of RBP binding sites.
iCLIP: Individual-nucleotide resolution CLIP is a refinement of CLIP that allows single-nucleotide resolution of RBP binding sites.
miCLIP: Methylation individual-nucleotide-resolution crosslinking and immunoprecipitation is a specialized version of iCLIP designed to determine which RNA nucleotides are methylated by the RNA methyltransferase Nsun2.
And also eCLIP:
eCLIP maps the binding sites of RBPs on their target RNAs using a modified individual nucleotide resolution CLIP (iCLIP) protocol, improving efficiency and decreasing execution complexity. The hallmark of this method is the ligation of barcoded single-stranded DNA adapters, which reduce amplification bias significantly.
https://www.illumina.com/science/sequencing-method-explorer/kits-and-arrays/eclip.html
Issue – GDC
Firehose: legacy, hg19
- within sample:
- Counts per million (CPM) : seq-dep
- FPKM (SE: RPKM): 1. seq-dep 2. tx length
- TPM: 1. tx length 2. seq-dep
- between sample:
Awesome datasets
Xena:
DESeq2
vignette: https://bioconductor.org/packages/release/bioc/vignettes/DESeq2/inst/doc/DESeq2.html
Input data:
key point:
- interger matrix
- un-normalized count: fit DESeq2 statistical model
- can take RNA-seq counts as well as ChIP-seq feature counts
Statistics for Genomic Data Science
Awesome online tools
Interactive Venn diagram: http://www.interactivenn.net/#
Amazingly comprehensive cistrome (TF, histone, open chromatin) database and analysis tool from Shirley Liu's lab: http://cistrome.org/db/#/
Gene set:
GeneWeaver: https://www.geneweaver.org/
MSigDB: http://software.broadinstitute.org/gsea/msigdb/index.jsp
ATAC-seq analysis
Pre-processing
First things first. We noticed that Trimmomatic is not suitable for the new batch of ATAC-seq sequencing file. After trimming, short fragments(i.e. shorter than 142 bp) will be lost. It turns out that current mainstream trimming softwares are not compatible with Nova-seq and Next-seq. And we have run our sequencing on a Nova-seq. After arduous searching and debugging, we found that Fastp was designed for these two new Illumina sequencing platforms and can handle what we've encountered.
Common usage of fastp to process ATAC-seq fastq file:
fastp -i R1.fq.gz -I R2.fq.gz -o ./R1_clean.fq.gz -O ./R2_clean.fq.gz -L -g -l 15 -p -w 16Quality control
As for ATAC-seq quality control, I'm currently implementing ENCODE ATAC-seq standard. As it happens, threre is an R package encodeChIPqc for calculating all sorts of parameters mentioned in ENCODE for estimating seq quality. It should be noted that calculating PCR bottleneck coefficient should be done before removing duplicates which will remarkably increase the original PBC value.
Removing and calculating duplicates is done by picard:
picard MarkDuplicates I=in.bam O=out_dedup.bam M=out_dups.txt REMOVE_DUPLICATES=trueThen removing removing non-primary chromosome (GRCh38 only):
samtools idxstats in.dedup.bam | cut -f1 | grep -v KI | grep -v GL | grep -v MT | xargs samtools view --threads 10 -b sample.bam > out.clean.bamIf the aligner did not put chr suffix infront of chromosome number, it is also neccessary to add them manually:
samtools view -H test.bam | sed -e 's/SN:1/SN:chr1/' | sed -e 's/SN:2/SN:chr2/' | sed -e 's/SN:3/SN:chr3/' | sed -e 's/SN:4/SN:chr4/' | sed -e 's/SN:5/SN:chr5/' | sed -e 's/SN:6/SN:chr6/' | sed -e 's/SN:7/SN:chr7/' | sed -e 's/SN:8/SN:chr8/' | sed -e 's/SN:9/SN:chr9/' | sed -e 's/SN:10/SN:chr10/' | sed -e 's/SN:11/SN:chr11/' | sed -e 's/SN:12/SN:chr12/' | sed -e 's/SN:13/SN:chr13/' | sed -e 's/SN:14/SN:chr14/' | sed -e 's/SN:15/SN:chr15/' | sed -e 's/SN:16/SN:chr16/' | sed -e 's/SN:17/SN:chr17/' | sed -e 's/SN:18/SN:chr18/' | sed -e 's/SN:19/SN:chr19/' | sed -e 's/SN:20/SN:chr20/' | sed -e 's/SN:21/SN:chr21/' | sed -e 's/SN:22/SN:chr22/' | sed -e 's/SN:X/SN:chrX/' | sed -e 's/SN:Y/SN:chrY/' | sed -e 's/SN:MT/SN:chrM/' | samtools reheader - test.bam > test_chr.bamshift coordinates, this is for ATAC-seq only:
alignmentSieve -b sample.bam -o sample.filtered.bam --minMappingQuality 10 --filterMetrics log.txt --ATACshiftAnalysis
I mainly refer to Harvard ATAC-seq Guidelines.
Generating signal track
For generating signal track using Deeptools, there are a few things that should be taken into consideration:
- since we have previously removed duplicates, we should now use --ignoreDuplicates
- low complexity regions should be excluded by --blackListFileName
- using --maxFragmentLength 100 to plot NFR regions
- NFR: < 100
- Mono-: 180 ~ 240
- Di-: 315 ~ 437
Peak calling
MACS2 is an old package but it work just fine. The Harvard guideline recommends a newly developed package Genrich, but I couldn't make it call peak properly.
The MACS2 parameters are:
macs2 callpeak --treatment treat.dedup.bam --name treat -g hs --bdg -q 0.05 --keep-dup all -f BAMPE --nomodel --shift -100 --extsize 200Software and pipeline list:
- fastp: https://github.com/OpenGene/fastp
- encodeChIPqc: https://github.com/imbforge/encodeChIPqc
Collection of ATAC-seq figures
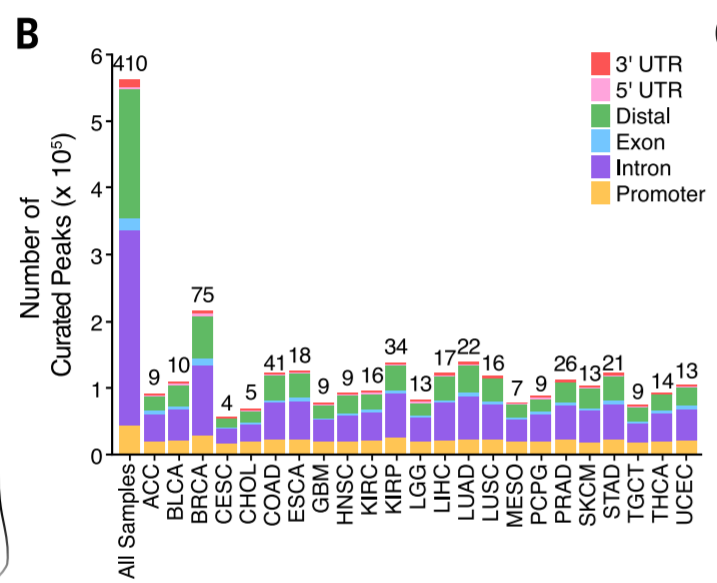
- Peak distribution
Peak calling + annotate distribution
2. Signal track
Calculate coverage + normalization
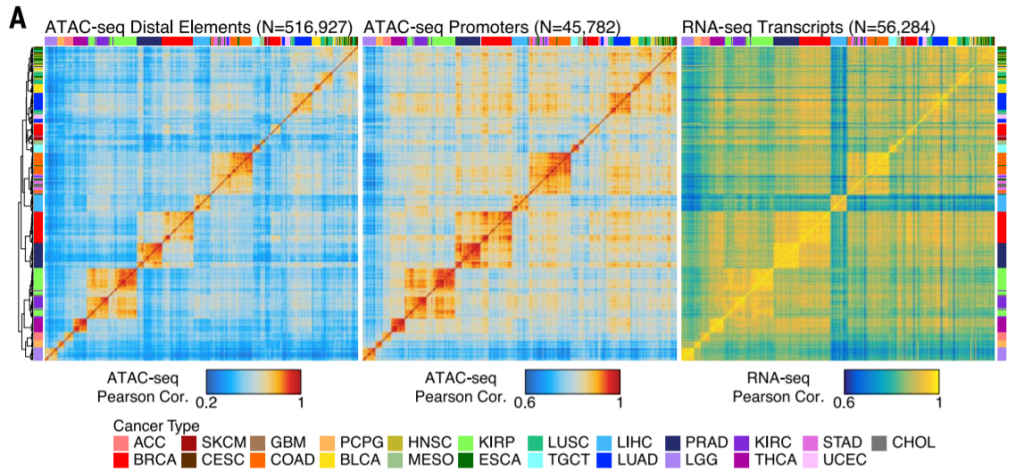
3. Pearson correlation heatmap
Large sample size + split component (distal/promoter) + calculate Pearson correlation
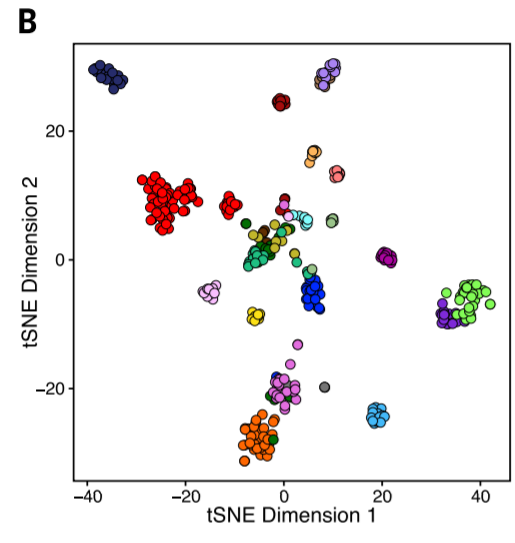
4. Unsupervised tSNE clustering
Large sample size + tSNE
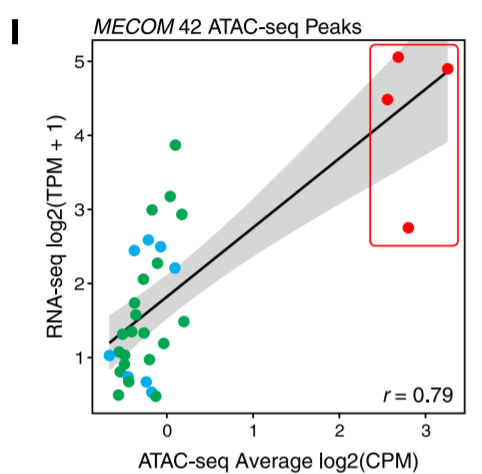
5. Correlation plot of chromatin accessibility and gene expression
Large sample size + RNA-seq + linear regression
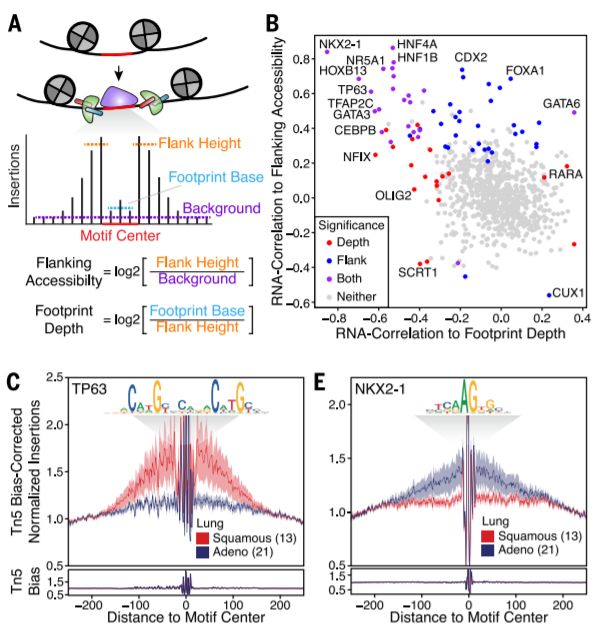
6. TF footprinting analysis
Require sequencing depth + long calculation time
(B): + RNA-seq
❗ ❗ not compitable with motif enrichment
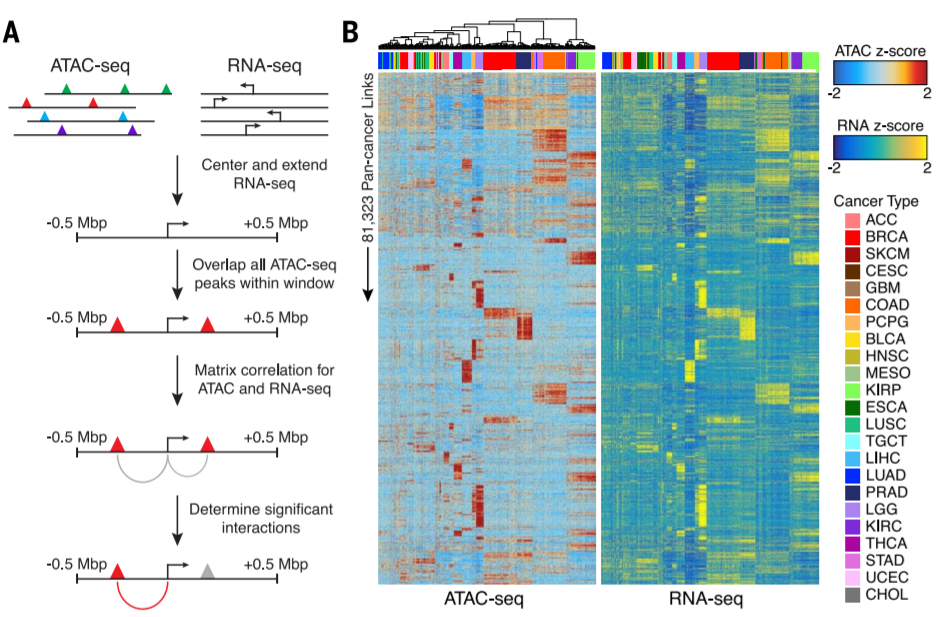
7. ATAC-seq peaks to genes link prediction
Large sample size + ATAC-eQTL
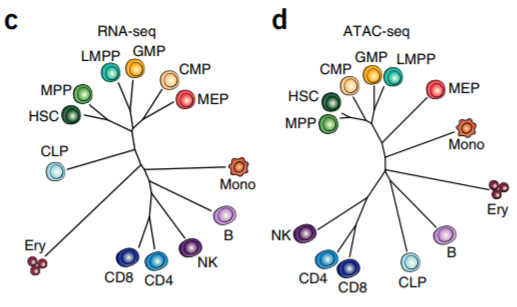
8. Phylogenetic dendrogram
Large sample size + clustering
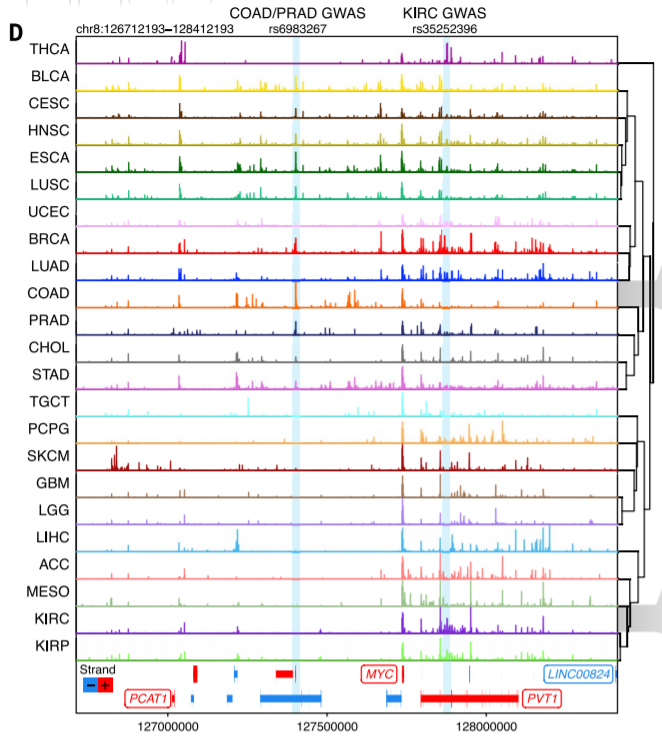
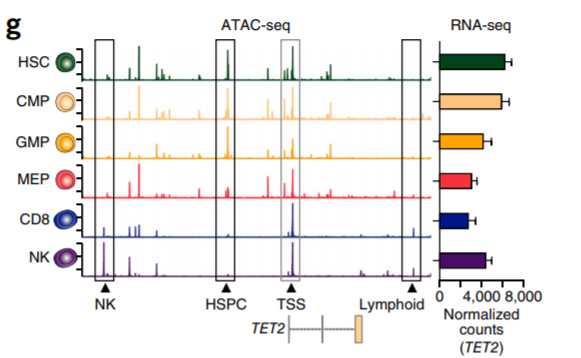
9. Signal track and gene expression
Compute coverage + normalization + RNA-seq
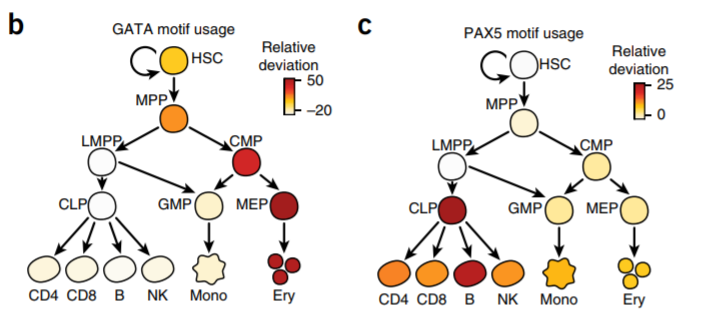
10. TF usage across crowds
Large sample size/scATAC-seq + motif enrichment (chromVAR)
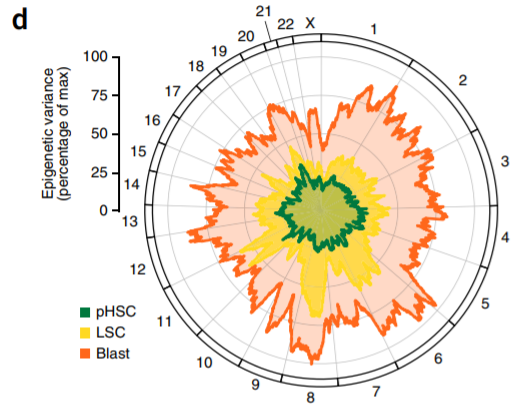
11. Mean variance in ATAC-seq signal across the linear genome
Large sample size + calculate variance
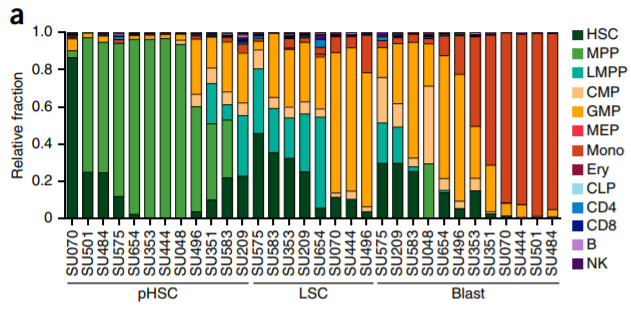
12. Cell type components deconvolution
Require established signature + suport vector regression (CIBERSORT)
13. Peak accessibility changes
Chronological samples (#bars = sample size - 1)
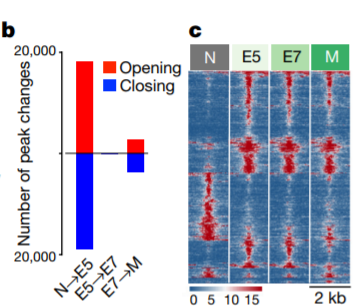
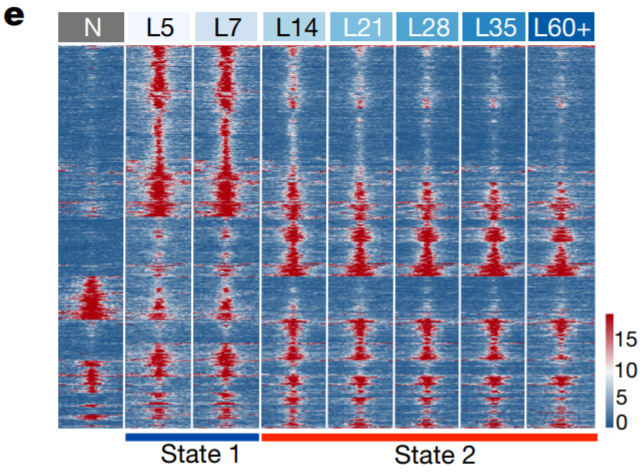
14. Chromatin accessibility heatmap
Compute coverage
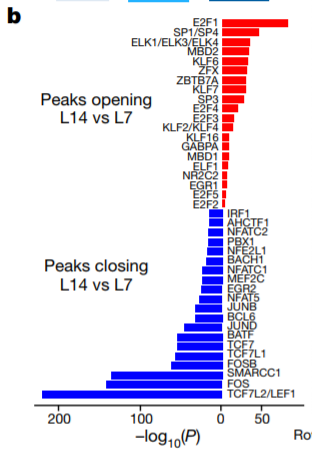
15. TF motif enrichment between 2 samples
Differential peak calling + motif enrichment
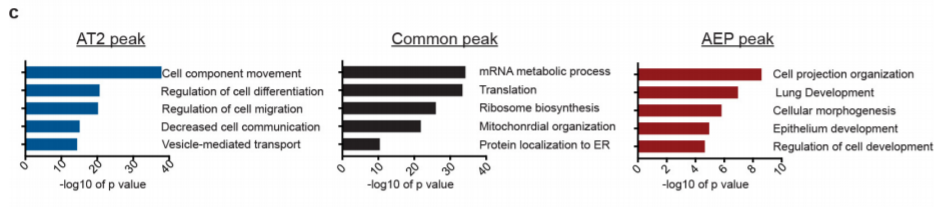
16. GO enrichment of peak nearby genes
Peak calling + GO enrichment
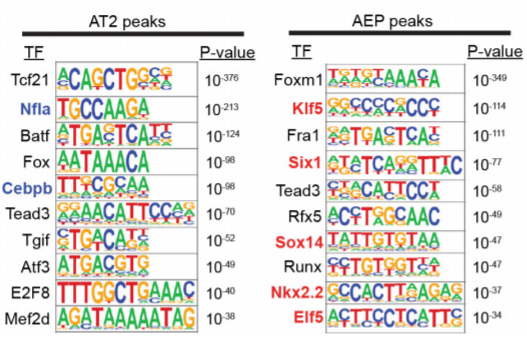
17. TF motif enrichment
peak calling + motif enrichment
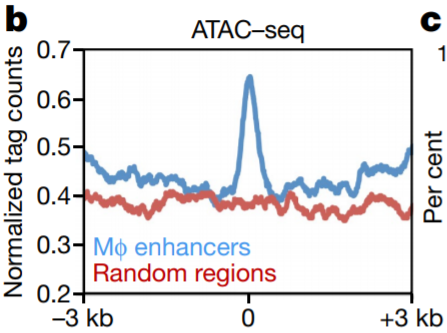
18. Singal density plot
Compute coverage + calculate average density
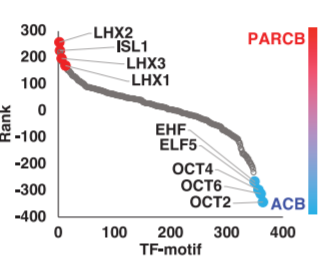
19. TF motif enrichment downfall plot
Peak calling + motif enrichment
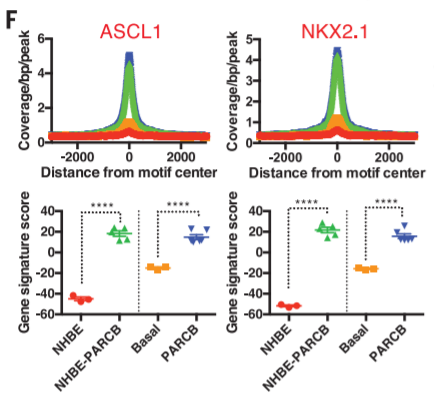
20. TF 'footprint' + gene signature score
Peak calling + footprint + RNA-seq
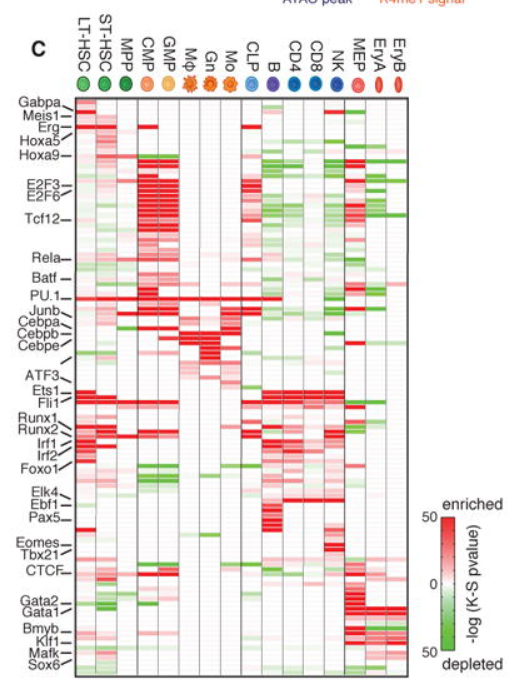
21. TF heatmap
Peak calling + motif enrichment + map P value